
Quick Answer
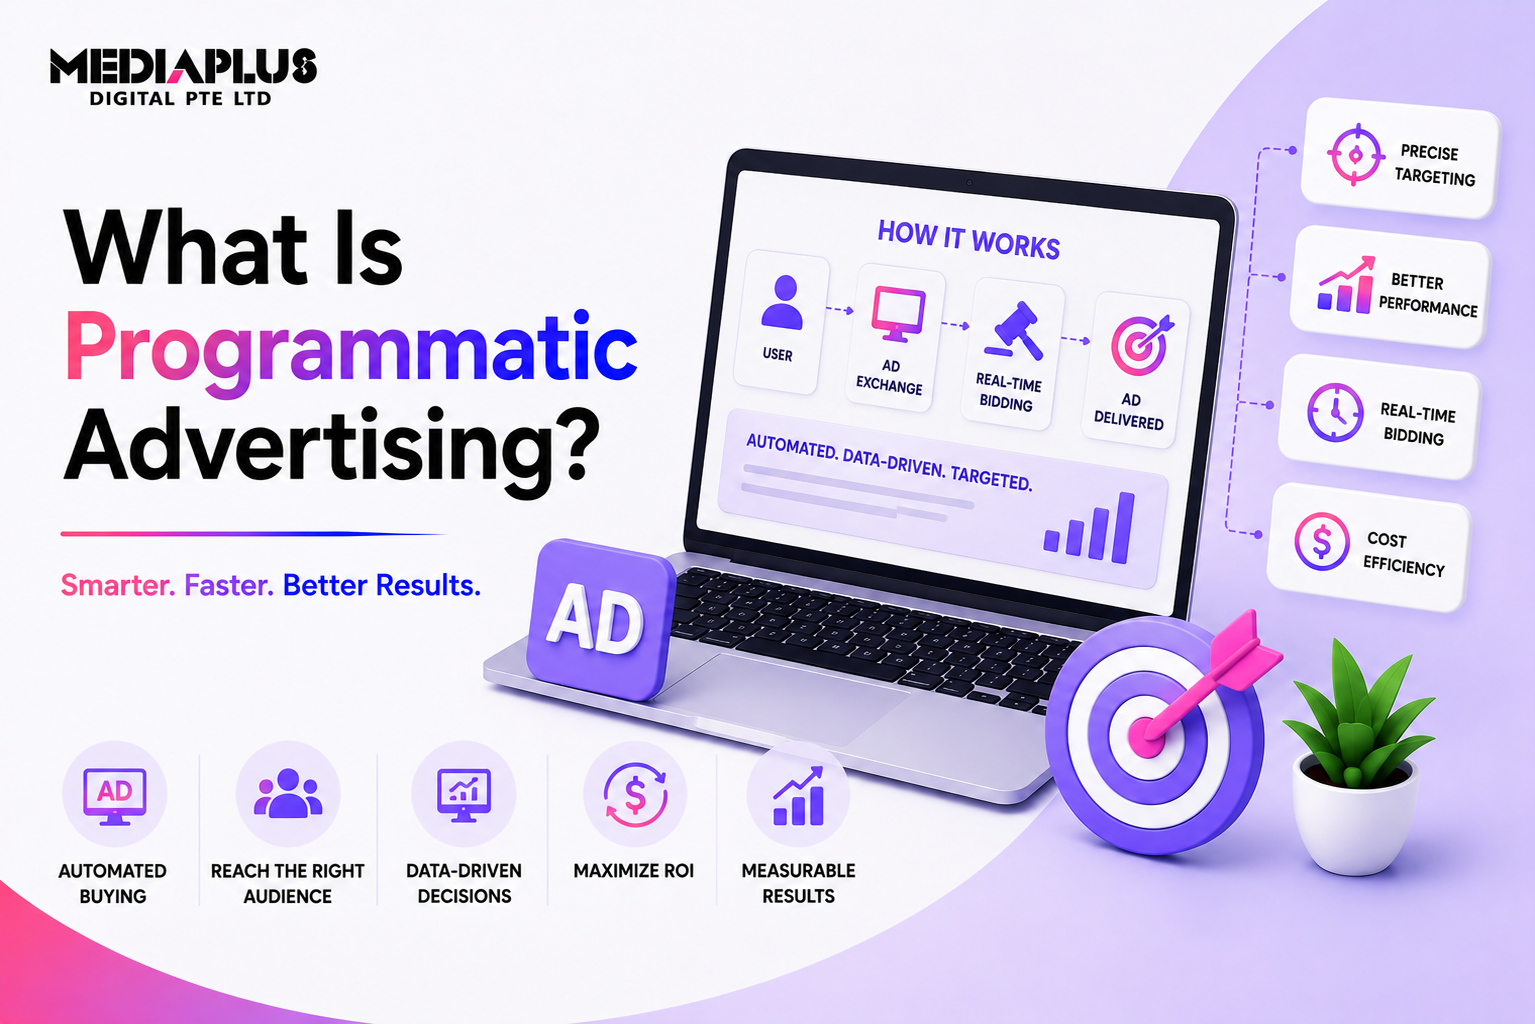
Programmatic advertising is buying ad space through software that runs an auction for each individual impression, in the time it takes a page to load, rather than through a salesperson and an insertion order.
That is the easy part. The part worth your attention is where the money goes. The Association of National Advertisers has been measuring this with matched log-level data since 2023, and its most recent quarterly benchmark, for the first quarter of 2026, found that 43.3% of programmatic spend delivered an impression that was fraud-free, measurable, viewable and not on a junk site. The rest went on platform fees, data fees, and impressions nobody could see or verify.
The number that should change how you buy is this one. Average CPM in that benchmark was US$4.42. Adjusted for the waste, the best-performing advertisers paid a true cost of US$7.46 per thousand impressions that actually counted. The worst paid US$19.04. Same market, same inventory, roughly two and a half times the real price.
Programmatic is not a scam. It is an auction you can win or lose badly, and most of the losing is done by advertisers who are not looking closely. This page is about how to look.
What Programmatic Actually Means
Three things get confused here, so it is worth separating them.
Programmatic is a buying method, not a channel. You can buy display, video, audio, connected TV and digital billboards programmatically. You can also buy display non-programmatically, direct from a publisher. The word describes how the transaction happens, not what you get.
It is not the same as the Google Display Network. GDN is one source of inventory, bought through Google Ads. Programmatic through a demand-side platform reaches a much wider pool of exchanges and publishers, with more control and more ways to lose money. We cover the network side separately in what display advertising is.
Most digital advertising is now programmatic. Dentsu’s December 2025 forecast expects 81.4% of global digital spend to be traded programmatically in 2026, which the same release describes as more than four-fifths of digital investment. So this is not a niche tactic. It is the default plumbing of digital media.
How One Auction Works
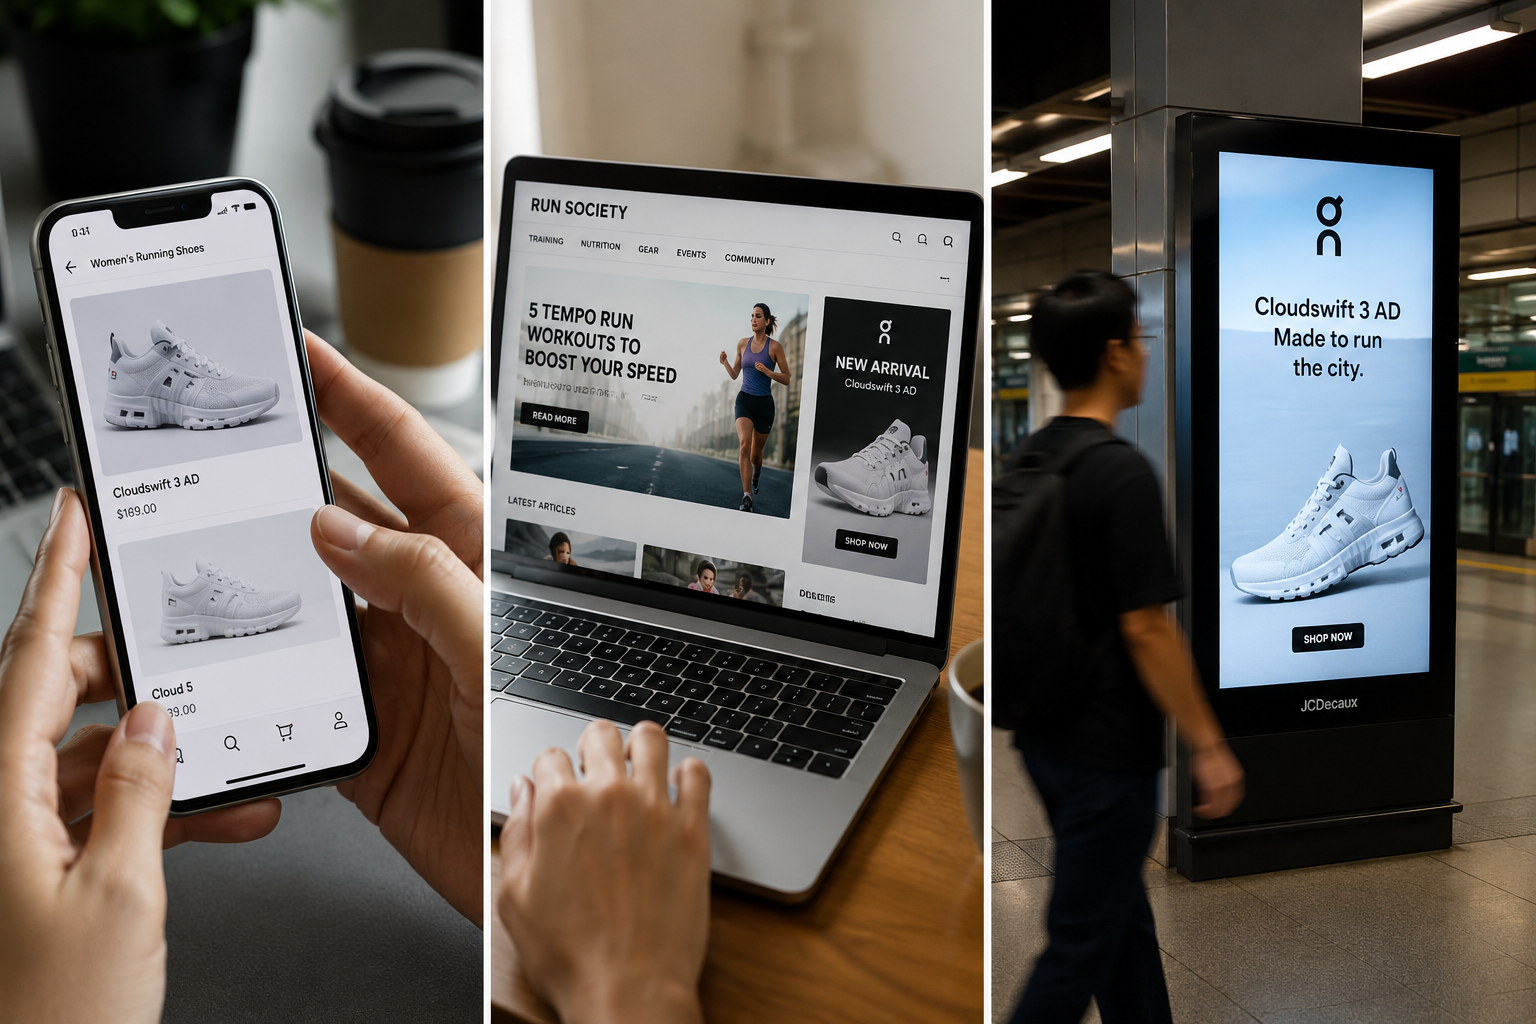
A page starts loading. An ad slot on it needs filling. What happens next takes less time than you spend reading this sentence.
The publisher’s ad server asks a supply-side platform to fill the slot. That platform broadcasts a bid request to many demand-side platforms at once. Each bid request carries what is known about the impression: the site or app, the ad size and format, the device, approximate location, and whatever identifier is available for the user. Each demand-side platform decides in milliseconds whether any of its advertisers wants this impression, and at what price. Bids come back, the highest eligible one wins, and the winner’s ad markup is returned and rendered.
The protocol underneath all of this is OpenRTB, maintained by IAB Tech Lab, currently at version 2.6. In the spec’s own words, the goal is “to create a lingua franca for communicating between buyers and sellers.” A detail that says something about the industry: OpenRTB 3.0 exists but, in IAB Tech Lab’s own words, “was not widely adopted by the ecosystem.” Everyone runs on a protocol whose successor was declined.
About that 100 millisecond figure
Almost every article on this subject states that a programmatic auction completes in 100 milliseconds, usually attributing it to an IAB standard. That attribution is wrong, and the correction is useful.
The OpenRTB specification sets no timeout at all. It defines a field called tmax, described as the “maximum time in milliseconds the exchange allows for bids to be received including Internet latency to avoid timeout,” and gives it no default value. The standards body deliberately leaves the number to each exchange.
Google’s own engineering documentation for Authorized Buyers gives a range rather than a figure: “Google waits 80 to 1000 ms for the bidder application to respond, depending on the format and auction type.” Real values in Google’s sample requests run from around 350ms for some video formats up to 1300ms for app requests.
The 100ms figure traces to an undated Google Ad Manager resource page which says the process “all happens within around 100 milliseconds.” It is a reasonable rule of thumb for the exchange-to-bidder round trip. It is not a standard, and it is not the whole auction.
There are actually three different timeouts, an order of magnitude apart:
|
What it governs |
Value |
|
Exchange to bidder response window (Google) |
80 to 1000 ms, by format |
|
Prebid.js header bidding default |
3000 ms in the shipped source code |
|
Prebid’s own recommended auction timeout |
1000 ms or less |
|
Prebid Server timeout, relative to the auction timeout |
50% to 75% of it |
If someone quotes you a single latency number for programmatic, ask which of these they mean.
Who Takes a Cut
The chain between your budget and a publisher has more links than most media plans admit.
Demand-side platform (DSP). The buying software. You set targeting, budgets and bidding here. Examples include The Trade Desk, Google’s Display & Video 360, Amazon DSP and Singapore-founded platforms such as Knorex.
Supply-side platform (SSP) and ad exchange. The selling software. Worth knowing: the distinction between these two is largely historical rather than technical. IAB Tech Lab’s own specification groups “exchanges, networks working with publishers, and sell-side platforms” into a single category. Both sit on the sell side and both speak the same protocol.
Ad server. Decides which campaign actually serves and returns the creative. The exchange produces a price; the ad server treats that price as one candidate competing against directly sold campaigns.
Data management platform (DMP) and customer data platform (CDP). These get used interchangeably and should not be.
|
DMP |
CDP |
|
|
Data it holds |
Third-party and aggregated segments, pseudonymous cookie and device IDs |
Your own first-party data, including names, emails and account IDs |
|
Identity model |
Segment membership, no durable individual record |
A persistent unified record per identified person |
|
Retention |
Short-lived by design |
For the life of the customer relationship |
|
What it feeds |
Ad platforms and exchanges |
Any downstream system, advertising being only one |
The practical version: a CDP is where your own customer data lives, a DMP is where you rent someone else’s audience. The first compounds in value. The second is a cost per impression.
First Price, Second Price, and Why It Changed
For years, programmatic auctions were second-price: the winner paid just above the second-highest bid. That is the classic auction design, and it means bidding your true valuation is safe.
It stopped working that way, and the mechanism is worth understanding because it still shapes what you pay.
Publishers set floors, and a soft floor quietly changes the auction. Microsoft’s Xandr documentation puts it plainly: a soft floor “allows the network to alter the mechanics of the standard second-price auction,” because with one in place the winner “pays either the soft floor’s net price or the second bidder’s bid depending upon which one is greater.” Below the soft floor you pay first price, above it second price, and buyers generally could not see where the floor sat.
Then header bidding broke the symmetry properly. Bids gathered in the page header arrive at the ad server as a single fixed price, so they behave like first-price bids, while Google’s exchange could see that number and clear at second price. Trade press called this last look.
Google announced the move to a unified first-price auction on 6 March 2019, tested it on 1% of traffic in June and 10% in August, began general rollout in mid-September and completed it by the end of that year. Google’s stated reason was that a single ad passing through multiple auctions with different rules had made it “difficult for advertisers and agencies to properly value programmatic inventory.”
The consequence for buyers is direct. Under second price, the clearing rule protected you from overpaying. Under first price, your bid is the price you pay, so every DSP had to rebuild that protection in software. That software is bid shading: predicting the lowest price likely to win and bidding just above it.
Which means when a platform tells you it saved you money through bid shading, it is describing a feature that only exists because the auction stopped protecting you.
The Four Ways to Buy
Most explanations of this get one thing wrong, so here it is correctly.
|
Open auction |
Private auction |
Preferred deal |
Programmatic guaranteed |
|
|
Price set by |
Open market bidding |
Bidding above a floor |
Fixed, negotiated |
Fixed, negotiated |
|
Inventory reserved for you |
No |
No |
No |
Yes |
|
Volume guaranteed |
No |
No |
No, you may decline |
Yes |
|
Who can buy |
Any buyer |
Invited buyers only |
One buyer |
One buyer |
|
Deal ID required |
No |
Yes |
Yes |
Yes |
Programmatic guaranteed is not a private marketplace deal. Google’s own definition is explicit: “Private Marketplace (PMP) deals refer to non-guaranteed programmatic deals. In Ad Manager, this includes Preferred Deals and Private Auctions.” Programmatic guaranteed sits outside that category because the inventory is genuinely reserved.
At the protocol level the distinction is two fields. Deal.at set to 3 means the stated floor “is the agreed upon deal price.” Deal.guar set to 1 means “the deal is of type guaranteed and the bidder must bid on the deal.” That is the whole difference between an auction and a booking.
The best definition of what a deal ID is actually for comes from the OpenRTB implementation guide: “A Deal ID should be utilized for any situation where the auction may be awarded to a bid not on the basis of price alone.”
One market fact that should shape how you read all of this: the open auction is no longer where serious money goes. In the ANA’s fourth-quarter 2025 benchmark, private marketplaces carried over 92% of median spend, and 100% of connected TV transactions ran through them. An advertiser buying open auction only is fishing in what everyone else already passed over.

Where the Money Goes
This is the section worth reading twice.
The Association of National Advertisers ran a supply chain study across 21 advertisers, US$123 million of spend and 35.5 billion impressions, using matched log-level data from both the buy and sell sides. Published December 2023. For every US$1,000 entering a demand-side platform:
|
Stage |
Amount |
|
DSP platform fee |
$80 |
|
DSP additional tools and features |
$20 |
|
DSP data and pre-bid segments |
$60 |
|
SSP platform fee |
$130 |
|
Reaching the seller |
$710 |
|
Lost to non-viewable impressions |
$95 |
|
Lost to invalid traffic |
$5 |
|
Lost to non-measurable impressions |
$150 |
|
Lost to made-for-advertising sites |
$100 |
|
Effectively reaching a consumer |
$360 |
Three caveats that matter, and any article quoting the 36-cent figure without them is misleading you.
The study covered open web display and video only. No connected TV, no walled gardens like Meta or Google Search. The data period was September 2022 to January 2023, mostly US inventory. And critically, agency fees and brand safety losses were outside its scope. The ANA says so directly: “Depending upon those costs, less than 36 cents of every dollar would effectively reach the consumer.”
What the current numbers say
That 2023 study is the one everybody quotes. It is also three years old, and the ANA now publishes a quarterly benchmark with a much larger sample, 86 participating marketers as of the first quarter of 2026. The picture has changed in a way worth understanding.
|
ANA 2023 study |
ANA Q1 2026 benchmark |
|
|
Share of spend delivering a qualified impression |
36% |
43.3% |
|
Made-for-advertising share of spend |
15% |
1.1% |
|
Average CPM |
US$2.66 |
US$4.42 |
|
Median supply-side platforms per advertiser |
not reported |
17, down from 19 |
|
Active domains per advertiser |
~44,000 |
28,958, down from 53,799 |
So junk inventory has been largely cleaned out, and buyers have cut their supply paths and domain lists substantially. Yet total efficiency only moved from 36% to 43%.
The reason is the useful lesson. The waste moved rather than disappeared. Losses shifted from obviously bad websites toward impressions that were never measurable and never viewable, plus the transaction fees, which nobody has cut.
And the gap between good and bad buyers widened to the widest the ANA has recorded, 21.9 percentage points. Their own summary of it: “the lower-performing cohort loses more than two-thirds of every dollar before it reaches the end consumer.” Their conclusion is worth pinning above your desk: “quality, not cost, is the primary differentiator in programmatic performance.”
For the agency layer, the ISBA and PwC study of the UK market put agency fees at 7% of advertiser spend, with publishers receiving 51% and a 15% “unknown delta” nobody could account for. When ISBA repeated it with 2022 data the picture had improved sharply: the unknown delta fell to 3%, and publisher revenue rose to 65%.
The waste is real. It is also shrinking, and it is concentrated among buyers who are not watching.
What the Singapore Numbers Say
This is where a generic explainer stops being useful, because Singapore does not look like the global average.
DoubleVerify’s 2025 Global Insights report, published July 2025, measured over a trillion impressions across desktop, mobile and connected TV. The Singapore rows are unflattering in two places and genuinely good in one.
|
Measure |
Singapore |
APAC |
Global |
|
Fraud and sophisticated invalid traffic |
1.6% |
0.8% |
APAC runs 18% below global |
|
Brand suitability violations |
9.4%, up 14% year on year |
7.7% |
APAC sits 50% above global |
|
Authentic viewable rate |
64% |
61%, the lowest of any region |
70% |
|
Attention Index |
114 |
114 |
100 baseline |
Read that carefully. Singapore’s fraud rate is double the APAC average, which DoubleVerify attributes to a 54% surge in non-human data centre traffic in Singapore alongside rising bot and emulator fraud. Singapore is a regional data centre hub, and that infrastructure cuts both ways.
Brand suitability violations are rising, not falling. And fewer than two thirds of impressions are both measurable and viewable.
The Attention Index is the bright spot. At 114 against a global baseline of 100, ads that do get seen in Singapore hold attention better than the global average. The problem is not audience quality. It is what you are buying and whether anyone is checking.
For comparison, Vietnam’s fraud rate in the same report was 0.4%. Singapore is not expensive because it is premium. Part of what you pay for here is traffic that is not human.
Two pieces of context so this is not read as worse than it is. First, these are region-level rates on inventory already being monitored, so they say nothing about unprotected open-exchange buying, which is worse. Second, the global trend is improving: DoubleVerify’s first-quarter 2026 benchmark put global fraud and sophisticated invalid traffic at 0.5%, down 24% year on year, with global authentic viewability up to 74%. Singapore’s numbers sit above the global average for fraud and below it for viewability, and that gap is the argument for verification rather than an argument against the market.
What Happened to Cookie Targeting
Almost everything written about this is out of date, including on some of our own pages, so here is the verified position.
Google announced the end of third-party cookies, then reversed it. In July 2024 it said it would not deprecate them. In April 2025 it said it would not even ship a standalone opt-out prompt, citing “divergent perspectives on making changes that could impact the availability of third-party cookies.”
Then the bigger turn, which got far less coverage. On 17 October 2025 Google announced it was retiring most of the Privacy Sandbox technologies and moving away from the Privacy Sandbox branding altogether. The reason, in its own words: “After evaluating ecosystem feedback about their expected value and in light of their low levels of adoption, we’ve decided to retire” them. The same day, the UK competition regulator formally released Google from the commitments it had made over the programme.
So as of now, third-party cookies are fully supported in Chrome, there is no deprecation date, and the replacement programme has itself been cancelled.
The advertising APIs being removed include Topics and Protected Audience, which were the two that mattered for programmatic. They were deprecated in Chrome 144 in January 2026 and are being removed through staged rollouts during 2026, a process that has already slipped past its original target. What survives is a small set of privacy plumbing rather than advertising tools: partitioned cookies (CHIPS), federated identity (FedCM), and anti-fraud tokens.
One detail worth knowing because nearly every article gets it wrong: trade coverage generally lists Fenced Frames among the survivors. Google’s own status page, updated August 2026, lists it under “deprecate and remove.”
So what do you target on
Four things carry the weight now, and only the first two matter for most Singapore SMEs.
Your own first-party data. Customer lists, purchase history, logged-in behaviour, app events. Matched into a platform through a customer data platform or a clean room. This is the only asset here that compounds rather than depreciating.
Contextual targeting. Page and content level, requiring no user identity at all. It never went away, it got considerably better, and it is the cleanest option under the PDPA because there is no personal data in it.
Unified ID 2.0. An open-source framework from The Trade Desk that turns a consented email or phone number into a salted hash usable across platforms. It matters mainly because it works in connected TV and apps, where cookies never existed.
Google PAIR and seller-defined audiences. PAIR matches one advertiser’s first-party data against one publisher’s, encrypted so neither side can reverse it and only the match rate comes back. The important limit is that the match does not travel beyond that one pairing, so it cannot build a cross-site profile. Seller-defined audiences work from the other direction: the publisher classifies its own audience against a standard taxonomy of around 1,600 attributes and passes a category, not an identity.
For a Singapore SME, first-party data plus contextual does most of the useful work. Add Unified ID 2.0 if you are buying connected TV.
Consent and the PDPA
Singapore’s rules differ from Europe’s in a way that catches people out in both directions.
The PDPC’s Advisory Guidelines for Selected Topics, revised May 2024, address this almost as if written for programmatic. Chapter 7 states that “the PDPA applies to the collection, use, or disclosure of personal data using cookies,” and names “device fingerprints, IP addresses and cookies” among identifiers that are programmatically generated.
On IP addresses the guidance is nuanced. An address alone “may not be personal data when viewed in isolation, because it simply identifies a networked device,” but “the more data points associated to a unique IP address an organisation collects, the more likely that an individual may be identifiable from the data.”
Two points that surprise people. Singapore does not require a European-style consent wall: “consent may also be reflected in the way a user configures his interaction with the Internet.” But there is a hard limit immediately after, and it is the one that catches people out: “the mere failure of an individual to actively manage his browser settings does not imply that the individual has consented.” Browser configuration can be consent. Silence cannot.
And on who owes the duty when a third-party tag is involved, the guidance is explicit that where a website operator is not itself collecting the data, “the obligation is on the third party organisation to obtain the consent required.” The vendor dropping the pixel can carry the consent obligation, not only the publisher.
One clarification worth making because it comes up constantly. The Do Not Call Registry does not apply to programmatic. It is three separate registers, for voice calls, text messages and faxes, and it governs marketing messages sent to a Singapore telephone number, including via WhatsApp and Telegram. It has nothing to do with buying display or connected TV inventory. Email marketing falls under the Spam Control Act instead.
If you do run outbound messaging alongside your advertising, note that a DNC check result is valid for 21 days from receipt, after which you have to check again. Older guidance citing 30 or 60 days is obsolete. No check is needed where you hold clear, unambiguous consent in evidential form for that specific number. And consent to retarget someone with display ads is not consent to text them.
The penalties for getting data protection wrong changed on 1 October 2022. For breaches from that date, the maximum financial penalty is 10% of the organisation’s annual turnover in Singapore where that turnover exceeds S$10 million, and S$1 million otherwise. Note that this is a threshold test, not the “whichever is higher” formulation you will see quoted.
What It Costs to Run
No major demand-side platform publishes a minimum spend for Singapore. We checked The Trade Desk, Google’s DV360, Yahoo DSP, StackAdapt, Knorex and Adzymic directly. None lists one. Every specific figure circulating online traces back to either a competing platform or a company selling reseller access, and they contradict each other by as much as tenfold.
What determines your practical floor is the route in: a direct enterprise seat carries the highest commitment, a partner or reseller seat lowers it and adds a markup, agency managed service lowers it again with a management fee, and a managed private marketplace buy through a regional platform is usually the cheapest way in.
One published requirement explains the whole shape of this market: Google requires DV360 partners to maintain at least five certified full-time local experts per country. That is why the partner layer exists and why few organisations hold a seat directly here.
Worth knowing as of this year: Amazon expanded Amazon DSP into Singapore in late September 2026, as one of five new markets, with no published fee or minimum spend.
So what should you actually budget
We cannot give you a sourced minimum because none exists. We can reason from the figures above, which is more honest than quoting someone’s guess.
A campaign needs enough qualified impressions for the platform’s optimisation to settle and for results to be readable rather than noise. Take a realistic effective cost per thousand for decent Singapore inventory with verification layered on top, then note that the bottom cohort in the ANA data is losing two thirds of every dollar precisely because its volumes are too thin to optimise against.
On that reasoning, a meaningful test starts somewhere around S$8,000 to S$15,000 a month, sustained for at least three months, plus verification fees. Treat that as our estimate derived from the benchmarks rather than as a published figure. Below roughly S$5,000 a month you are mostly paying platform and data fees on volumes too small to learn anything from, and search or social will do more with the same money.
Viewability, Precisely
“Viewable” has an exact definition, and it is lower than most people assume. From the Media Rating Council’s guidelines:
Display. At least 50% of the ad’s pixels in the viewable space of an in-focus browser tab, for at least one continuous second. The pixel threshold has to be met before the clock starts.
Large format display. For ads of 242,500 pixels or more, equivalent to a 970 x 250 unit, a 30% pixel threshold may be used instead of 50%, and this has to be disclosed.
Video. 50% of the ad’s pixels, for two continuous seconds, and those two seconds need not be the first two.
One second, half the pixels, and for video the sound does not even have to be on: the guidelines state that detecting audio “is not currently a requirement.” That is the bar. As the ANA notes, these “are minimal criteria,” and advertisers “are free to negotiate higher standards with media partners.”
Then the step most reporting skips. Before an impression can be judged viewable it has to be measurable at all, and often it is not, because the publisher would not accept the verification tag. In the ANA data, median measurability was 86% and 85% of measurable impressions were viewable, so 73% of total impressions were both. Non-measurable inventory was the single largest loss line in the whole waterfall.
Brand safety has no governing body right now
This is current and most published material has not caught up.
The Global Alliance for Responsible Media, which maintained the brand safety floor and suitability framework the whole industry used, was discontinued on 9 August 2024, days after X Corp sued the World Federation of Advertisers alleging an advertiser boycott.
The case was dismissed, and X and the WFA settled on appeal on 29 July 2026. Terms were mostly undisclosed, with one exception that matters: the WFA committed that it will not form or restart GARM or a similar initiative.
So as of now there is no successor body, and the organisation that ran the old framework is contractually barred from rebuilding it. Platforms and verification vendors still ship the GARM-derived tiers, but they are legacy implementations rather than a maintained standard. IAB Tech Lab’s Content Taxonomy 3.1 is the live standard for contextual classification, and it makes no reference to GARM.
Practical consequence: brand safety settings in your DSP are now vendor policy, not industry standard. Read what they actually exclude.
Made for Advertising Sites
A category worth naming because it is where cheap CPMs lead.
Made-for-advertising sites carry an ad-to-content ratio at least double the web average, auto-refresh their ad slots, buy their traffic rather than earning it, and publish generic templated content.
Here is the trap, in the ANA’s words: MFA sites “exhibit high measurability rates, good viewability rates, and low levels of invalid traffic, and usually have brand-safe environments.” They pass every hygiene check. What they fail is outcomes. Jounce Media puts ads on MFA sites at at least 50% less effective on brand lift.
They also clear at 25% lower CPMs than legitimate inventory, which is precisely why price-led buying drifts toward them.
Scale, and the direction of travel, which is genuinely good news: the 2023 ANA study found MFA at 21% of impressions and 15% of spend, with every one of its 21 advertisers carrying some. By the first quarter of 2026 the ANA benchmark had MFA exposure down to 1.1%. Jounce Media, which counts auctions rather than spend, had the category peaking around 25% of web inventory in summer 2023 and classifies under 5% now.
So this particular problem has largely been fixed. The ANA has started flagging AI-generated filler content as the emerging version of the same thing, which is worth watching rather than worrying about yet.
And the counterintuitive finding. MFA ran heavily through private marketplaces, the deals sold as premium:
|
Deal type |
CPM |
MFA share of impressions |
|
Private marketplace, 1 to 10 domains |
$6.03 |
0.02% |
|
Private marketplace, 11 to 500 domains |
$8.49 |
1.3% |
|
Private marketplace, over 500 domains |
$5.52 |
19.8% |
|
Open marketplace |
$2.75 |
26.8% |
The ANA’s conclusion: private marketplaces containing more than 500 domains “delivered quality similar to the OMP deals, but at double the cost.”
If someone sells you a premium private marketplace deal, ask how many domains are in it. That single question separates the two useful rows in that table from the useless one.
Where Budgets Actually Get Wasted
Six failures, each with a mechanism rather than a platitude.
Buying too broadly. The average campaign in the ANA study ran across 44,000 websites. Their recommendation: “Buyers should be able to get the scale they need by selecting 75 to 100 trusted sellers.” On a small budget, 44,000 domains means none of them receives enough delivery to learn anything from.
Using exclusion lists instead of inclusion lists. The ANA is blunt: “Exclusion lists are largely ineffective. There are just too many websites for exclusion lists.” Their survey found only 6% of advertisers running inclusion lists only, and a quarter of those using them did not know how often they were updated. General Motors found its ads on unsuitable sites despite having exclusion lists in place, then switched to inclusion lists and cut both invalid traffic and over-frequency.
Bidding against yourself. The average DSP connects to more than 50 supply-side platforms, and among the top 100 domains by spend, ads ran through six to eighteen SSPs each. The ANA’s framing is exact: “if there are multiple divisions within the same company bidding on the same keywords (or inventory), an advertiser may be competing against itself and paying too much.” Their recommendation is five to seven SSPs, which reaches close to all available supply with two paths to any given impression.
Nobody looking. Only 46% of marketers track how many websites a campaign ran on. Only 21% track made-for-advertising activity. Only 27% receive supply-side platform data at all.
Buying verification and then ignoring it. Integral Ad Science found fraud on unoptimised campaigns running up to 14 times the rate of optimised ones. DoubleVerify measured 1.1% fraud on managed campaigns against 5.1% unmanaged, spiking toward 25% on individual days, and authentic viewable rates of 65% managed against 46% unmanaged. The measurement tag changes nothing on its own.
Paying for impressions nobody could measure. The ANA’s recommendations are unusually direct: “Advertisers should only pay for impressions that are measurable,” “Advertisers should only pay for impressions that are viewable,” and “Marketers should not pay for impressions with IVT.” Agree the remediation route, whether refunds or make-goods, before the campaign runs rather than after.
Is It Worth It for a Singapore SME
Programmatic earns its place when you have a reach problem search cannot solve, meaning your buyers are not searching for what you sell yet. It also earns it for remarketing at scale, and for connected TV and digital out-of-home, where Singapore’s infrastructure is unusually mature.
It is the wrong first channel if people are already searching for you and you have not captured that demand.
The threshold question is not really budget. It is whether anyone will read the placement report. On the evidence above, the gap between a managed and an unmanaged campaign is roughly a factor of four or five on fraud and around twenty percentage points on viewability. If nobody is going to look at a domain list monthly, spend the money elsewhere.
Frequently Asked Questions
What is programmatic advertising in simple terms?
Buying ad space through software that auctions each individual impression as a page loads, instead of negotiating with a salesperson. It covers display, video, audio, connected TV and digital billboards.
How fast is a programmatic auction, really?
The commonly quoted 100 milliseconds is a rule of thumb for the exchange-to-bidder round trip, popularised by Google rather than set by a standards body. OpenRTB specifies no timeout at all, and Google’s own documentation gives a range of 80 to 1000 milliseconds depending on format.
What percentage of my budget actually reaches a consumer?
The ANA measured about 36 cents of every dollar entering a demand-side platform, for open web display and video, excluding agency fees and brand safety losses. So the real figure is lower. The ISBA’s UK work found the picture improving, with publisher revenue rising from 51% to 65% between 2020 and 2022.
Is programmatic riskier in Singapore than elsewhere?
On fraud, yes. DoubleVerify measured Singapore’s fraud and sophisticated invalid traffic rate at 1.6% against an APAC average of 0.8%, attributing it partly to a 54% surge in non-human data centre traffic. Singapore’s Attention Index, at 114 against a global baseline of 100, is above average, so the audience is good and the supply needs watching.
What is the minimum budget for programmatic?
No major platform publishes one for Singapore, and every figure circulating online comes from a party with an interest in the answer. Your practical floor depends on whether you access a platform directly, through a reseller, through an agency, or through a managed private marketplace buy.
Do I need consent under the PDPA to run programmatic ads?
Where targeting involves collecting personal data through cookies, yes. Singapore does not require a European-style consent wall, and browser configuration can reflect consent, but a user simply never touching their settings does not count as consent. The Do Not Call Registry does not apply here, since it governs calls, SMS and fax.
Going Further
If you want this run rather than explained, our programmatic advertising page covers how we handle supply path selection, inclusion lists and verification reporting.
For the surrounding topics, see what display advertising is, search ads versus display ads, and programmatic campaign examples.